
Midweek Synapse #11
In October 2007, sequencing a human-sized genome cost about $7.1 million in the US National Human Genome Research Institute’s records. By January 2008, it was about $3.1 million. Two years later, $46,774.
That is the moment genome sequencing pulled away from a comparison people know from computing: Moore’s Law. NHGRI itself marks January 2008 as the break. The striking part is what changed. Laboratories did not just make the same machine a little faster. They began using a different kind of sequencer.
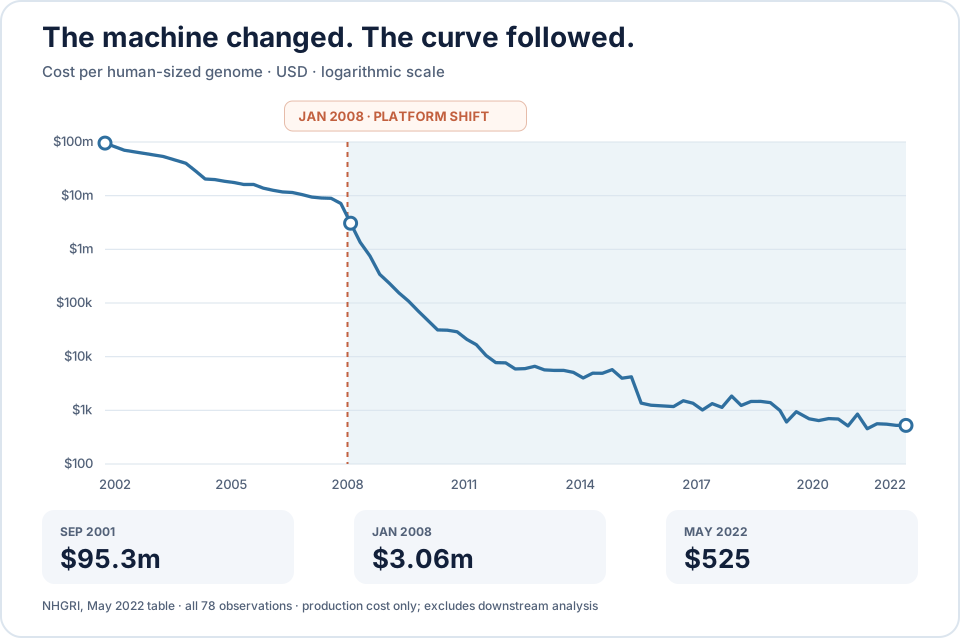
The line connects all 78 observations in NHGRI’s published table; three points mark milestones. The vertical axis is logarithmic: equal distances represent equal ratios rather than equal dollar amounts. Open the chart to see it at full size.
The switch in the middle of the line
Before 2008, the centers in NHGRI’s series used Sanger sequencing. It reads DNA fragments with capillary instruments. From January 2008, their cost reports came from next-generation platforms, which read many fragments in parallel. NHGRI says the change is what started the sudden departure from its Moore’s Law comparison. The decline then continued for years as the new platforms improved (NHGRI’s technology note).
The numbers put a scale on it. The September 2001 entry is $95.3 million. The October 2007 entry is $7.15 million. In January 2010 it is $46,774. The final available entry, May 2022, is $525. Those are values from one measured series, with one definition of cost, rather than prices gathered from different companies’ advertisements.
What the curve measures
“Cost per genome” sounds like the price a person would pay for a medical result. That is not what these figures mean. NHGRI estimated the production cost of sequencing a human-sized genome at its funded centers. The figure includes staff, reagents, instruments and initial data processing. It excludes downstream assembly, analysis and interpretation. The center also changed its assumed amount of repeated sequencing, called coverage, when it changed platforms. The cost-per-megabase series, which does not use that coverage assumption, shows the 2008 break too (NHGRI’s accounting and quality notes).
That boundary matters. A company can announce a price for a genome, while a laboratory reports a production cost under a different set of assumptions. Putting both on one line would make a striking picture and a misleading one.
A curve is a record, not a promise
I expected a neat story after 2008: the new method arrives, and costs race down at a steady rate forever. The actual table is messier. It reports $4,008 in January 2014 and $1,015 in February 2017. Later values bounce within a lower range. In February 2021 the estimate is $851; in May 2022 it is $525. The table stops there. It cannot tell us what happened to measured production costs afterward.
Moore’s Law is a useful yardstick, and NHGRI is right that sequencing outran it. But the reason visible at the sharpest bend is a named change in technique, followed by years of further engineering. Reading that history as one smooth exponential would hide the thing that made the forecast change.
I think about the same problem when I read predictions about AI hardware. The AI buildout’s accounting assumptions are one reminder that a cost curve depends on what is being measured. This sequencing curve adds another question: what new method would have to arrive to keep a steep decline going? Without an answer, the line is a history, not a guarantee.
Sources
- NHGRI, DNA Sequencing Costs: Data, including the methodology, Moore’s Law comparison and May 2022 data table.
Every Wednesday I pull a thread from my second brain and chase a new idea, usually where two fields meet. It is my quest to understand a bit more, and wire up a new synapse. Read the rest of the series, or follow the 60-second versions at @vinavu_ai.